dbt in Dagster: Everything the Manifest Doesn't Tell You
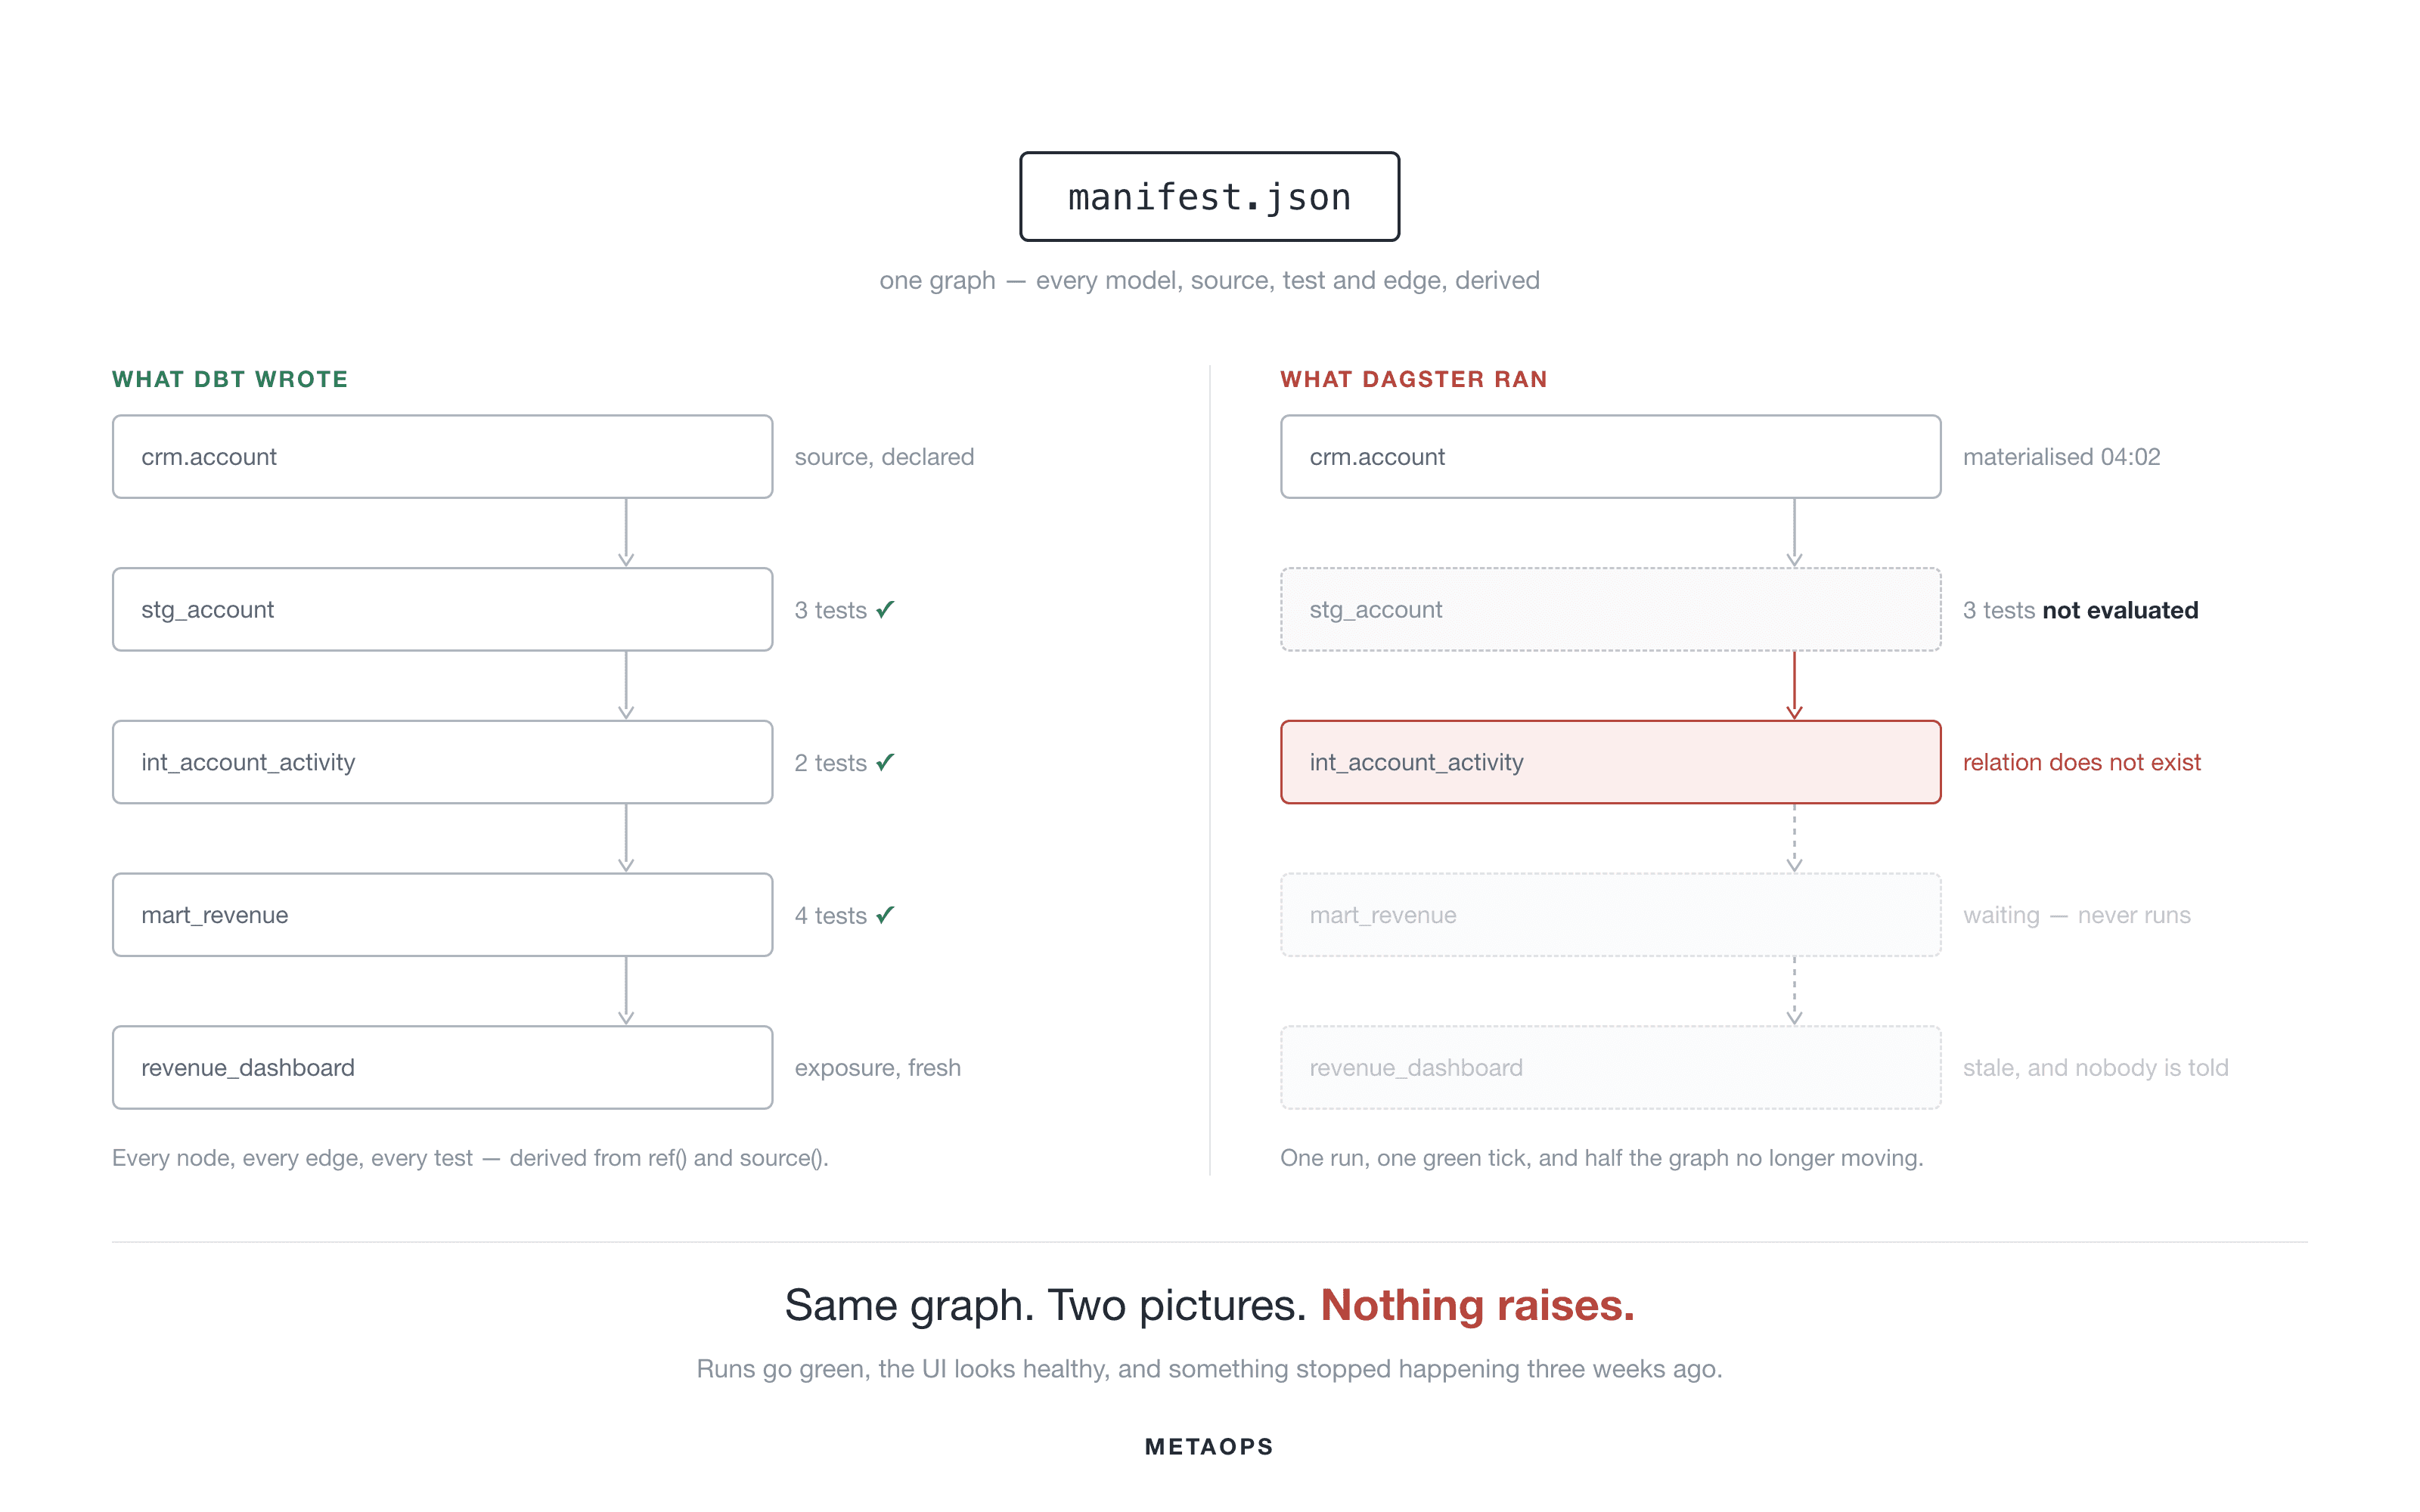
Eight places where Dagster's picture of your dbt project and dbt's own quietly drift apart — and what to do about each.
The graph dbt already wrote
The reason this integration exists is that dbt already knows everything an orchestrator needs. It writes the whole dependency graph to manifest.json — every model, source, seed, snapshot and test, with the edges derived from your ref() and source() calls — and per-node outcomes to run_results.json after every run. Most schedulers throw that away and look at a container exit code. dagster-dbt reads it and turns it into assets, asset checks, groups and scheduling policy.
Getting that working takes an afternoon. Keeping it working is the interesting part, and it's what this post is about.
Almost everything below shares a shape: nothing raises. Runs go green, the UI looks healthy, and something stopped happening three weeks ago. That's not a criticism of either tool — it's the natural failure mode when one system's model of the graph and another's drift apart. These are the eight places we've watched them drift.
Before you start
This is not an introduction to dagster-dbt. The documentation covers getting a dbt project into Dagster perfectly well, and everything here assumes you've already done it — that you have @dbt_assets loading a manifest, and you're comfortable with asset keys, asset groups, and dbt tests arriving as asset checks. It also assumes declarative automation — scheduling as a condition on each asset rather than a cron on a job — which is where half this post lives, and dbt build rather than dbt run, so a model's tests run immediately after the model itself. And a couple of sections go below the API surface, where it helps to know that a run carries a selection of assets and a separate selection of checks.
Gotcha 1 — One asset check can switch off every dbt test in a run
This is the worst one, because it silently destroys the thing you built the integration for, and the fix is somewhere you'd never look.
What you see. A dbt model materialises normally. Every one of its tests reads "not evaluated" — not passed, not failed, never ran. Anything gated on those tests stops moving. Nothing fails. The only trace is one line, buried in a run log:
What's actually going on has nothing to do with your dbt project.
A Dagster run's check selection is all-or-nothing-in-between. Either the run says nothing about checks, and every check on every selected asset runs; or the run names specific checks, and only those run. There's no middle setting.
Now consider an ordinary Python asset — some loader, unrelated to dbt — that declares a data-quality check inline with check_specs. Because a plain @asset can't be split up, that check isn't really a separate thing: the asset and its check are one step, and Dagster can't run one without the other. So when automation decides to materialise that loader, it has to ask for the check too. And the moment a run request names one specific check, the run switches into "only these checks" mode.
Everything else in that run loses its checks. Including your dbt models. dagster-dbt sees that it has been handed an empty list of checks to run for its own assets, concludes it must disable dbt's indirect test selection, and executes dbt build --select <model> with the tests switched off.
The blast radius is the sensor tick, not the asset. That's what makes this expensive. A small lookup-table loader with one warning-level check, and forty dbt models that build off it, sit in the same asset group. One group, one automation sensor, one run per tick — and the loader's single check deletes all forty models' worth of tests. On one deployment this took out more than a thousand checks a night, across three groups, for weeks. It was found because someone noticed a column of the UI had gone grey.

The fix is to make any asset carrying inline checks subsettable, so Dagster knows it can run the asset without dragging the check along:
can_subset=True doesn't remove the check from the asset. It tells Dagster the two can be run separately, so the run request stops naming it, the selection stays open, and every check — this one included — runs as it always did.
Two things to know before you convert everything. Declaring the asset with specs= types its output as Nothing, so a MaterializeResult must not carry a value= — that fails at execution time, not at load time, which is a bad way to find out. And the guard on selected_asset_check_keys isn't decorative: emitting a check result when the check wasn't selected will fail the step.
Nothing stops the next asset from being added without can_subset, so pin it: walk the resolved asset graph and fail a test on any asset that declares checks and isn't subsettable.
Gotcha 2 — eager() doesn't care whether your checks passed
AutomationCondition.eager() fires when an asset's dependencies have been updated. Updated, not healthy. A model whose parent just failed a blocking data-quality check rebuilds anyway, on data you already know is bad, and so does everything below it.
Define the vocabulary once and use it everywhere:
Only blocking checks count, and dagster-dbt decides blocking straight from dbt test severity: error is blocking, warn is not. Which means your dbt test severities are now scheduling decisions. That's worth walking your analytics engineers through, because they set severity thinking about noise in the dbt logs, not about whether the mart rebuilds tonight.
The warning that belongs next to this
all_deps_blocking_checks_passed() does exactly what it says, and people underestimate how strict that is.
It's all-or-nothing across every direct parent. A mart with eight upstream models, seven of them perfectly healthy, does not build if the eighth failed one blocking test. That's the trade you signed up for — correctness over freshness — but on a wide fan-in it bites more often than you'd expect, and the failure is silent: the asset simply sits there, waiting, with nothing in any alert channel.
It's worth being precise about the reach, because the obvious guess is wrong in an interesting way. The condition looks at direct parents only, not the whole ancestry. Something rotten five steps upstream doesn't gate your final mart directly. But the effect propagates anyway, by starvation: the immediate child of the bad asset doesn't build, so its children never see a dependency update, so they don't build either, and the stall walks down the chain one level at a time. The end of a long pipeline goes quiet for a reason that lives five hops away and never appeared in any alert.
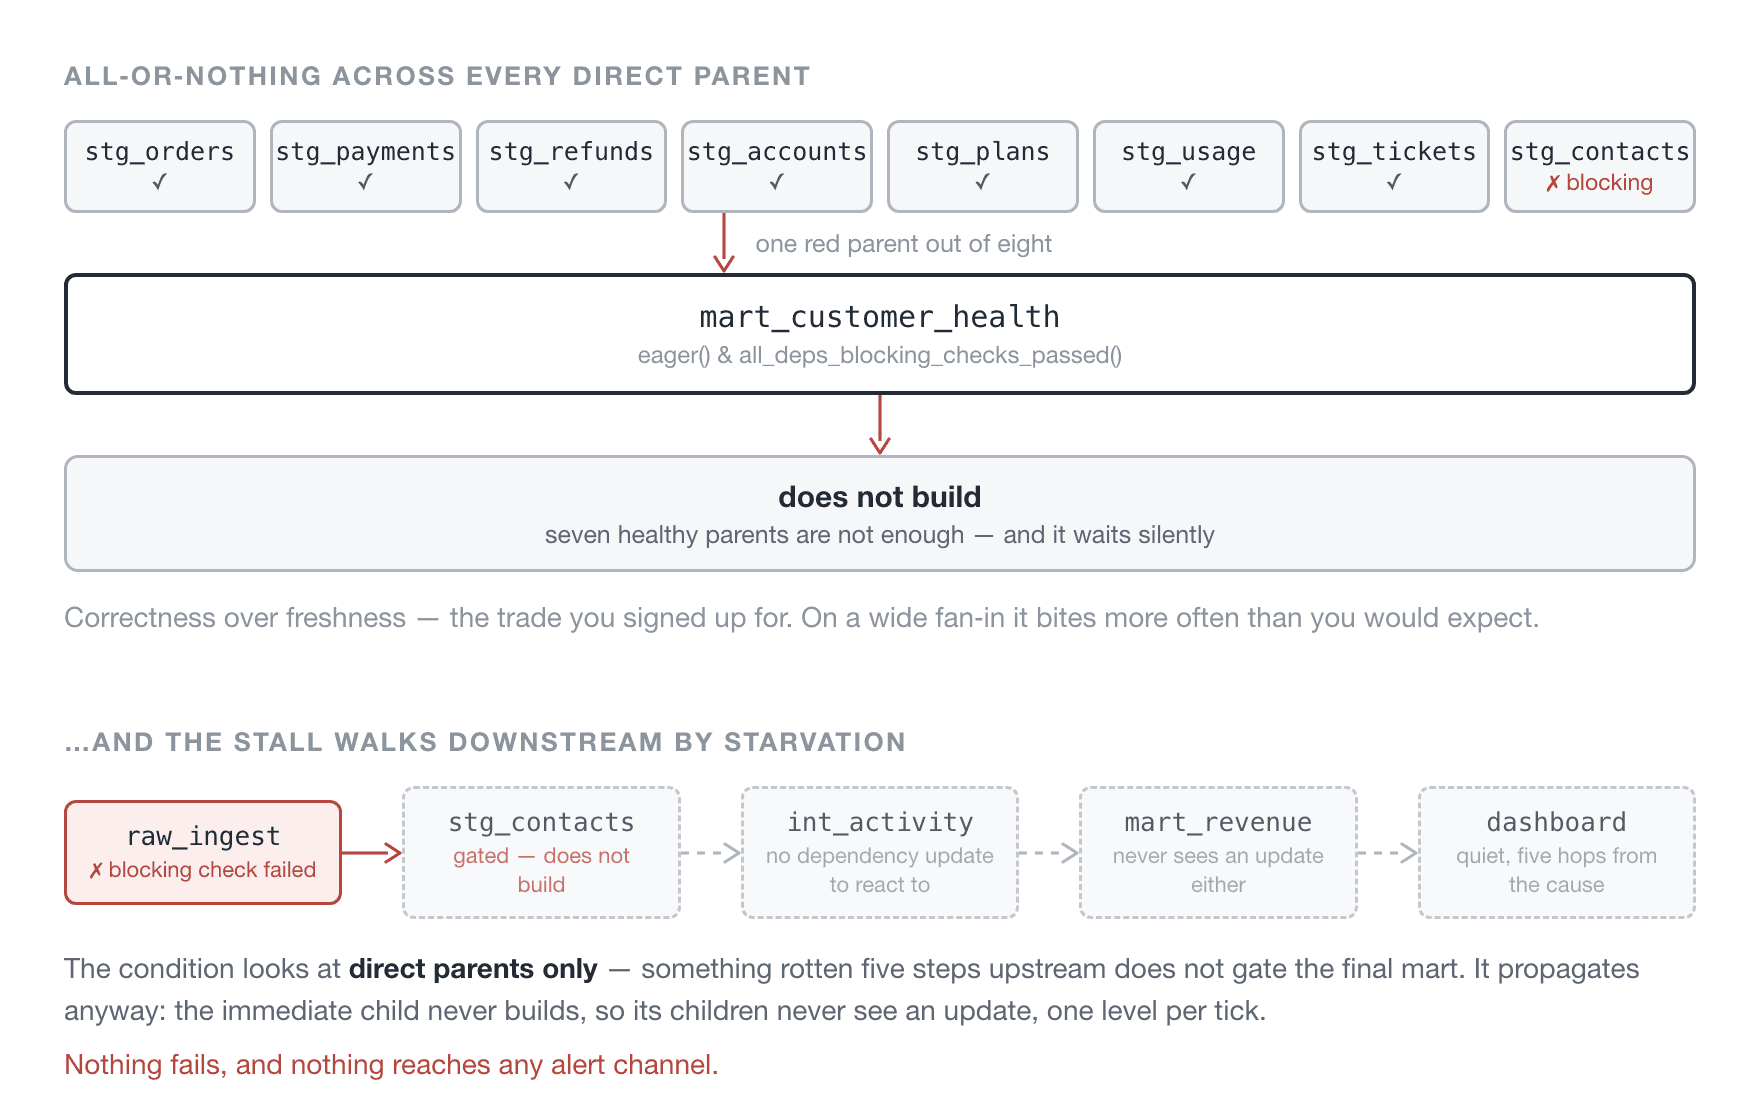
So: use it, but know that a single bad ingest can halt an entire branch, and give yourself two things. A way to see why something is waiting (the automation condition evaluation in the UI will tell you, but only if you go looking). And a way to say "not this dependency" — which is Gotcha 4.
The cold start it creates
Both halves of the condition are false on a fresh deployment, for different reasons. eager() won't fire while any parent has never materialised. And "blocking checks passed" means passed — not "hasn't failed" — so a check that has never run doesn't satisfy it either.
Between them a brand-new deployment sits perfectly still, with no error anywhere, and every individual piece looks correct. Keep an escape hatch and put it in the runbook:
Materialise the ingestion groups by hand, run this once, and automation takes over on its own from there.
Gotcha 3 — The manifest is read when the code loads, not when a run starts
@dbt_assets(manifest=...) reads the manifest at import time — when Dagster's code server builds your definitions — not when a run begins. If the manifest isn't there, the whole code location fails to load, taking down every unrelated asset that shares it. This catches people out because it feels like a runtime dependency and behaves like a build-time one.
So the manifest goes in the image, and the useful detail is parse, not compile:
Most write-ups say to run dbt compile in CI. compile opens a warehouse connection, which means getting a profiles.yml secret into your build. parse produces the same manifest without touching the database — it's what dagster-dbt's own project preparer uses internally. If your Dockerfile currently mounts database credentials purely to generate a manifest, they can go.
Local development gets it for free:
And resolve the project directory from the module rather than the process working directory, so it doesn't depend on where the command was run from:
One practical note while you're bringing this up for the first time. Until the Docker build is right, a missing manifest gives you a code location that won't load and an error that doesn't obviously point at the dbt step. It's reasonable to put the dbt block behind a flag for a day or two so you can see the rest of your assets while you sort the build out — just delete the flag once the image is building. It's a bootstrapping aid, not architecture; a permanently optional dbt integration is just a graph that's allowed to be missing pieces.
Gotcha 4 — Let dbt tags drive scheduling policy
Once you're past a hundred models, you don't want scheduling policy in the Python repo. Analytics engineers live in the dbt project and may never open the orchestration one. A tag grammar moves the decision to where the people who care about it already are:
What auto_ignore_ is really for
This one is worth explaining properly, because it looks like a niche escape hatch and it's actually the fix for a common graph shape.
Picture a diamond. You have a central model. One asset reads it directly. Another model is derived from that same central model, and your final asset depends on both — the central model and its derivative.
If everything sits under one sensor, this is fine: both parents land in the same evaluation and the final asset builds once. But the moment those parents are under different sensors — different groups, different crons — the two branches land at different times. The final asset sees a dependency update when the central model lands, builds on a derivative that hasn't caught up yet, then sees another update when the derivative lands, and builds again. Two runs, and the first one was on inconsistent data.
auto_ignore_<group> tells the condition to stop treating that branch as something to react to. The asset waits on the branch that actually determines readiness, and the other one comes along for the ride. One build, on consistent inputs.
It's also the release valve for the all-or-nothing gating in Gotcha 2 — if one parent is legitimately allowed to be stale or red without stopping the rest, this is how you say so.
Groups come from dbt too
Set once per folder, in dbt_project.yml:
The grouping is deliberate. Each staging folder joins the group of the pipeline that feeds it, so one sensor evaluates an ingestion source together with its staging wave and a stalled source can't stall the others. Everything from the intermediate layer down shares a single group and a single sensor.
That's the argument for running one automation sensor per group rather than leaning on the default one — a failing group can't stall automation for the rest. Derive the dbt groups from the parsed manifest rather than hard-coding them, and adding a group in dbt_project.yml grows a sensor with no Python change at all:
The dedupe there is load-bearing: two sensors with the same name is a hard error at load time, and staging groups deliberately share names with ingestion groups — merging each pair into one sensor is the point.
Worth noting how this interacts with Gotcha 1. Decoupling happens at the group boundary, and everything inside a group still batches into one run. Smaller groups shrink the blast radius of a poisoned check selection. They don't remove it.
Gotcha 5 — Two dbt projects in one deployment
Two situations get conflated here and they have nothing to do with each other.
One project, two targets. Two DbtProject instances over the same directory, and the trap is the manifest path:
Give them the same target_path and the second parse silently overwrites the first manifest, after which half your assets point at the wrong database and everything still loads fine. CI parses once per target and bakes both manifests.
Two genuinely different projects is the harder case, and the thing people hit first is asset key collision — two projects each containing a stg_accounts. That one at least fails loudly at load time.
Prefix in the second project's translator, conditionally, so only its models move:
Derive the prefix from something structural — package name, path — rather than a hand-maintained list, and let super() do the rest so the physical schema still drives the key. Keep each project's profile: distinct, which is what lets one deployment write to two databases with credentials that never meet. Each project gets its own resource key, and the asset function's parameter name picks which one it receives:
One more thing belongs here: dbt tests arrive as asset checks automatically through @dbt_assets. Only hand-written Python @asset_checks go in the asset_checks=[...] list on Definitions. Putting dbt-derived checks there is a route to double declaration, and it will look like it worked.
Gotcha 6 — The same physical table as more than one asset
Two projects on two databases, and the second needs a table the first builds. Copying it creates a sync problem you now own. A foreign data wrapper exposes it live instead:
dbt is delighted with this. Dagster is wrong about it. As far as the consuming project's manifest is concerned, that source lives in the consuming database and has no producer. It becomes an external asset with nothing upstream. The consuming models never wait for the producing project, and dependency-driven scheduling cheerfully builds them on whatever the foreign table happened to contain.
Decide which of two things you actually want, because they need different fixes.
One asset, two projects. The foreign table is the upstream model, and you want a single node with a real lineage edge. Give the source the producing asset's exact key:
Which needs the translator to check meta.dagster.asset_key first and fall back to convention — convention by default, configuration by exception:
Two assets, deliberately. The foreign table is a genuinely separate object with its own freshness and its own checks, and the consuming project is allowed to run against a slightly stale view of it. Give it its own key and an explicit dependency, and accept that ordering is now advisory rather than enforced.
The first reading is what makes cross-project scheduling work. The same trick covers warehouse data shares — Redshift, Snowflake — where the consuming project sees a shared table as local and has exactly the same blind spot.
And the trap inside the fix, which is a nasty one. meta.dagster.asset_key names the asset that writes the table, not the table. Write the table's own name there and nothing complains: Dagster mints an external, unrunnable asset for that key, hangs every model that reads the source off it, and leaves the real producer orphaned somewhere else in the graph. Since eager won't fire while a parent has never materialised, and a parent nothing can materialise never stops being missing, those models are blocked permanently. They don't fail, they don't warn, they just never run again and the table only moves when a human clicks materialise. A word-order difference between a loader's name and its table's name survived review for months on one deployment before anyone worked out why a schema had gone quiet.
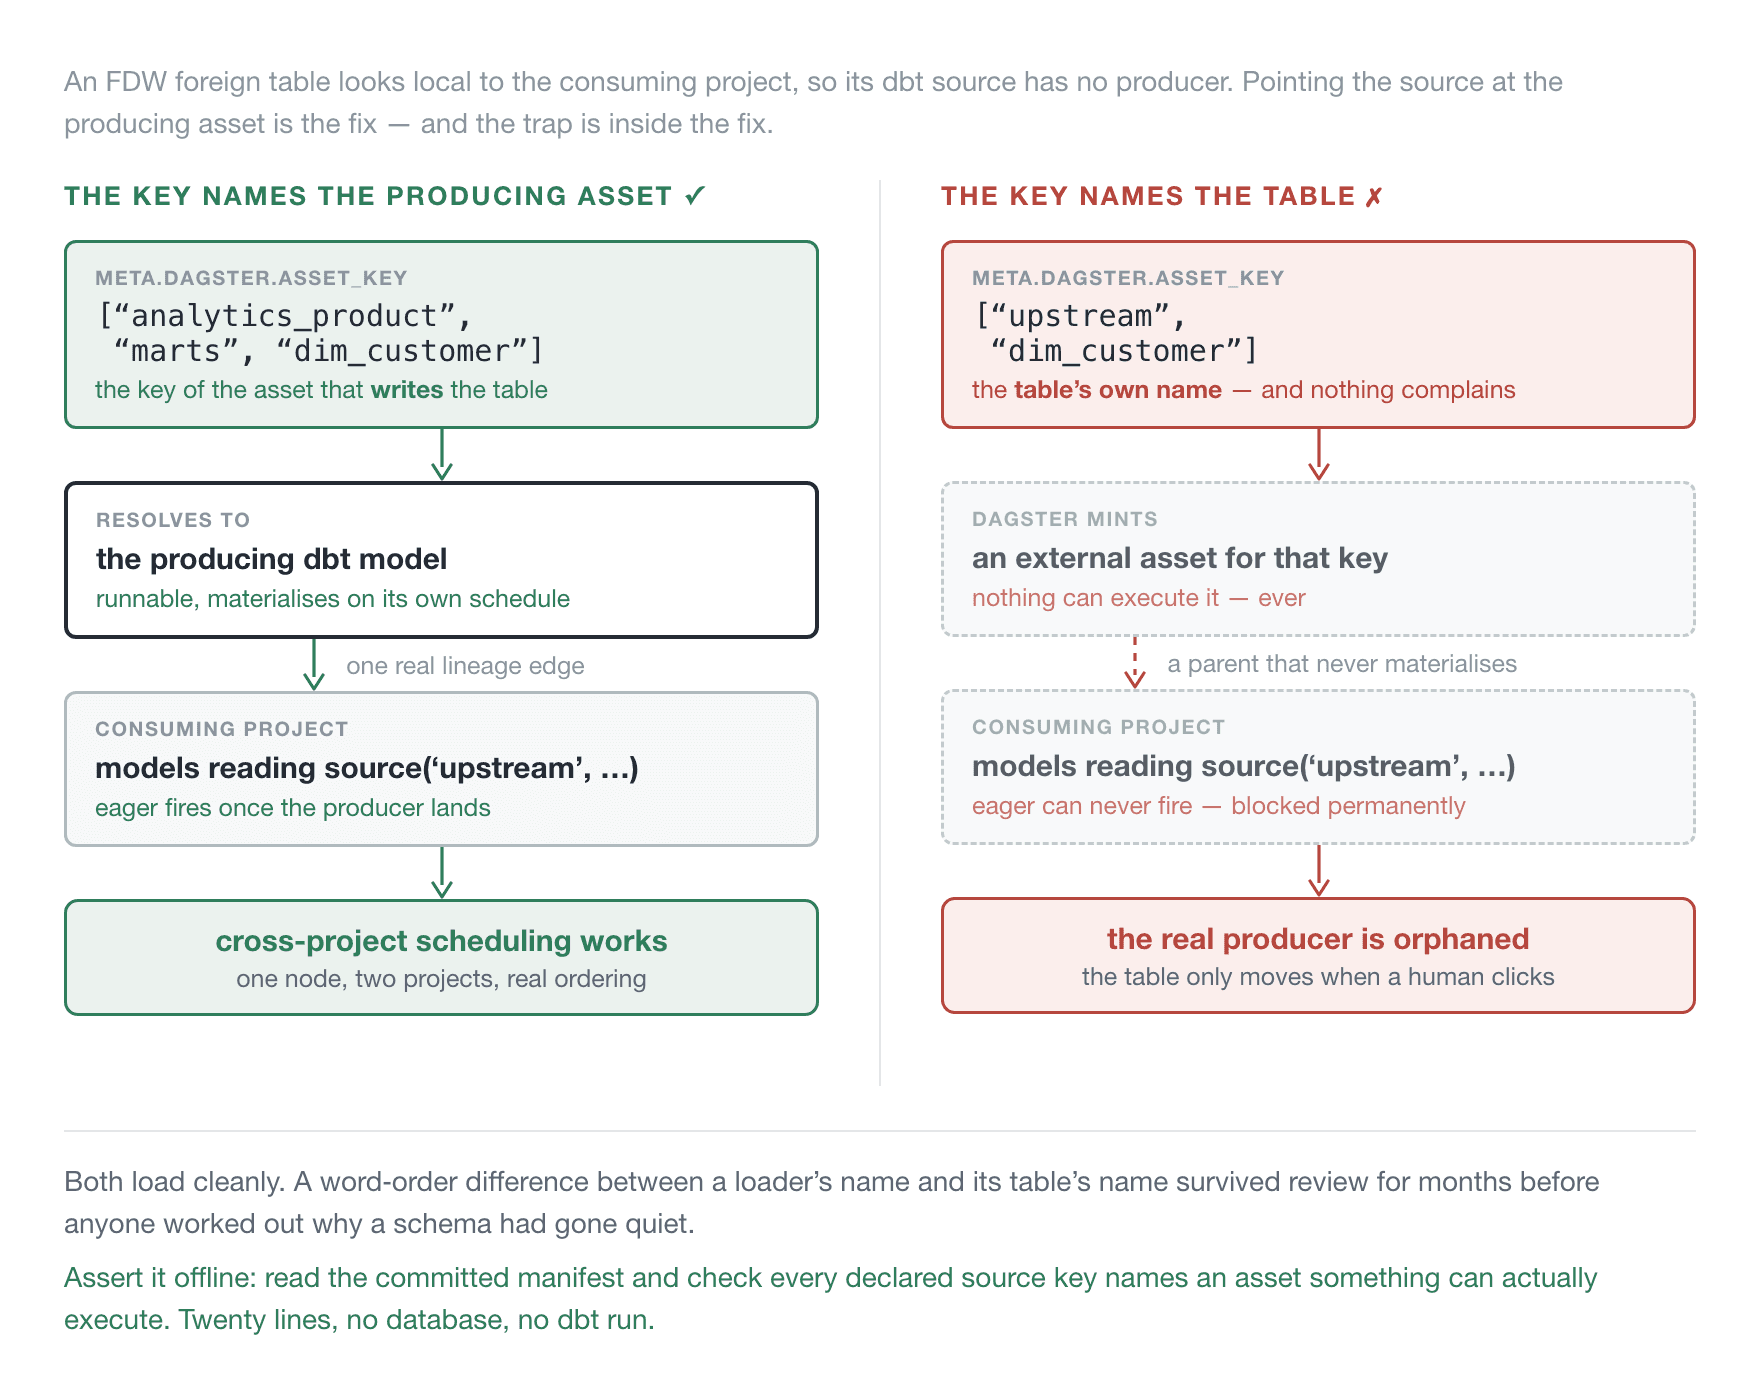
Assert it offline — read the committed manifest, resolve the asset graph, and check that every declared source key names an asset that something can actually execute. It's a twenty-line test with no database and no dbt run, and it catches a class of bug that is otherwise invisible for months.
Two operational notes on FDW itself. A foreign table's column list is a local definition, so it doesn't follow the remote schema — add a column upstream and the foreign table simply doesn't have it. Either re-import the table when it changes, or keep the expected column list in a dbt macro and drive an ALTER FOREIGN TABLE from a pre-hook, which makes a schema change a reviewable diff instead of manual DDL somebody forgets.
And a related case: one asset can legitimately write several tables — an ingest step that lands three related tables in a single run. dbt has to declare each as its own source, so several sources map to one asset key, and the uniqueness check rejects it. DagsterDbtTranslatorSettings(enable_duplicate_source_asset_keys=True) is what allows it, and it only relaxes the rule when every resource sharing the key is a source. Models still have to be unique.
Gotcha 7 — Partial selection breaks what whole-graph runs were hiding
This one is dbt-postgres specific, but the lesson generalises.
dbt-postgres rebuilds a view by creating the replacement, renaming the old one aside, and dropping it with CASCADE. Any dependent view not rebuilt in the same invocation goes with it.
Run dbt build yourself and this never bites, because the whole graph is one invocation and everything dependent gets recreated. Now let Dagster drive it. Automation subsets the graph per group, so the hourly staging wave runs on its own — and every dependent view in the intermediate layer is cascade-dropped and not rebuilt. Downstream queries start failing with relation "int_account_activity" does not exist, in production, at an hour nobody was watching.
The fix is one line of config: materialise anything that reads a staging view as a table. Tables survive the cascade, so a racing wave leaves you with stale-but-present data rather than a missing relation. On a warehouse of any reasonable size the extra cost is noise, and the failure it removes is a page. Then enforce it with a test, because someone will optimise it back to a view.
The general lesson is bigger than Postgres: an orchestrator that runs subsets of your dbt graph exposes every assumption that only held when the whole graph ran together. Anything relying on "and then the rest of the run fixes it" is now a bug waiting for the right tick.
Gotcha 8 — Nobody hears a non-blocking check fail
Two failure classes, two mechanisms, and only one of them is automatic.
A blocking check that fails fails its step, therefore the run, therefore reaches whatever run-failure alerting you already have. That's the whole argument for choosing severity: error deliberately rather than by default.
A non-blocking check that fails leaves the run successful. Nothing fires. Those results exist only for someone who opens the UI and navigates to the right page, which in practice is the same as not having them at all. You need a dedicated sensor — one that watches for successful runs, reads the check evaluations attached to them, and pushes failures out to wherever your team actually looks.
Two things we learned building one. dbt-generated checks and hand-written ones don't carry the same metadata, so a sensor that assumes a field is present will blow up on the first dbt check it meets — and it doesn't skip that check, it kills the whole sensor evaluation for every check in the run. Read defensively and fall back to Dagster's own severity. And cap the fan-out: the first run after a deploy with one misconfigured source produces dozens of failures at once, so send a summary above a threshold rather than a message per check.
Also worth knowing: the failing-row count is on the check as metadata (dagster_dbt/failed_row_count) whether or not you store failing rows, and that count is usually the operational signal you want. Which matters because store_failures has an inversion worth knowing about — a project-level +store_failures under data_tests: overrides a node-level store_failures: false, which is the opposite of how dbt config normally resolves. If you want it off, off at the project level is the only setting that reliably works, and you keep the counts either way.
The rules, condensed
dbt build, notdbt run. It interleaves each model's tests immediately after the model, so a failing test stops its own subtree inside the run rather than after everything downstream has been rebuilt.Any asset with inline checks must be a subsettable multi-asset, or it switches off every other check in any run it's batched into. Pin it with a test.
Gate every automation condition on upstream blocking checks — and understand that this is all-or-nothing across direct parents, and that a stall propagates down the chain by starvation.
dbt test severity is now a scheduling decision.
errorgates,warndoesn't.Bake the manifest with
dbt parse, notdbt compile— same file, no database credential in your build.Derive asset keys in a translator; override with
meta.dagster.asset_keyby exception. When you override, the key names the asset that writes the table, and a test should prove that asset exists and can run.Scheduling policy belongs in the repo analytics engineers already work in. A tag grammar beats a Python dict of model names.
One
target_pathper target, one@dbt_assetsfunction per project, one resource key each.Anything a partial selection can break, will break. Cascade-dropped views are the Postgres example; the class is larger.
Non-blocking checks need their own sensor, or they reach nobody.
The through-line is that manifest.json is the graph, and every failure here is a place where Dagster's picture of that graph and dbt's picture of it quietly came apart. None of them raise. Almost all of them can be caught by a handful of tests that read the committed manifest and the resolved asset graph, with no database and no dbt run — which is the cheapest guardrail in this whole stack, and the one most people skip.
A note on versions. This corner of the stack moves quickly, and some of the behaviour above has already changed shape once or twice between releases. Treat the specifics as a description of what we found rather than a permanent contract, and check anything surprising against the versions you're actually running. The failure modes have outlived several upgrades; the exact mechanisms have not always survived them.
The patterns above are drawn from orchestration work across a number of client engagements — the specifics differ every time, the failure modes rarely do. MetaOps designs, builds and stabilises open-source data platforms: Airbyte, dlt, dbt, Dagster and Kubernetes, deployed as code with Terraform, Flux and GitOps, and shipped through CI/CD pipelines that make a platform change a reviewable pull request rather than an evening's work. If any of the above sounded like a description of your Tuesday, get in touch.


Andrey Kozichev



Related Posts

governance
Oct 30, 2025
Ever inherited a data platform where nobody knows how schemas evolved, configurations vanish after migrations, and 500+ models have no lineage? While software development embraced DevOps years ago, data engineering got left behind - stuck with clickops, tribal knowledge, and the dangerous myth that "we'll automate later." We rebuilt our data platforms with a code-first approach using Terraform, dbt, and GitOps, achieving an 80% reduction in manual work and transforming unreliable deployments into boring, repeatable operations. Here's why if it's not in code, it doesn't exist - and why that principle saved our infrastructure.

data engineering
Feb 16, 2024
Developers have been tracking dependent API changes for years, we need to include data engineering as schema consumers that also need to be made aware of changes.